What would be the future of the business after Covid-19? The COVID-19 pandemic has changed how business is done. Below is a data collection from around the world that attempts to track what exactly changed and by how much.
We invite you to share this data with your friends and colleagues on social media, blogs and websites, and in your presentations. In the same way, people will be aware of what is happening in the business sector during the Covid-19 pandemic.
All we ask in return is that you recognize our efforts and mention us as the source.
Consumer Behaviour
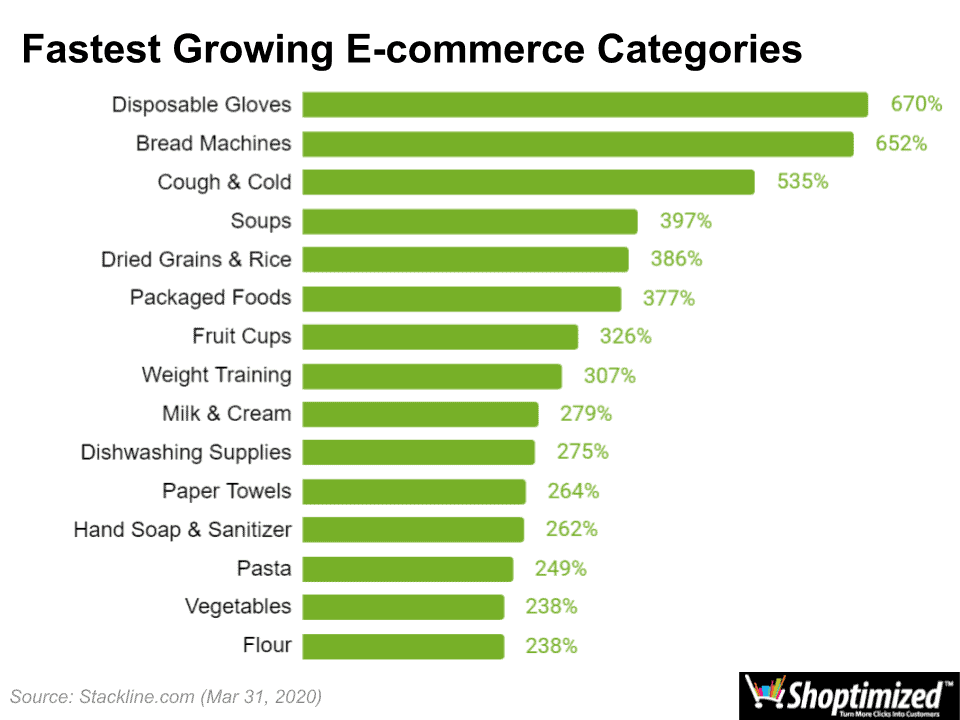
- The fastest-growing e-commerce categories in March 2020, were:
- disposable gloves (+670%)
- bread machines (+652%),
- and cough & cold medicine (+535%)
(Source: Stackline).
1-50 fastest growing e-commerce categories
1. Disposable Gloves +670%
2. Bread Machines +652%
3. Cough and Cold +535%
4. Soups +397%
5. Dried Grains and Rice +386%
6. Packaged Foods +377%
7. Fruit Cups +326%
8. Weight Training +307%
9. Milk and Cream +279%
10. Dishwashing Supplies +275%
11. Paper Towels +264%
12. Hand Soap and Sanitizer +262%
13. Pasta +249%
14. Vegetables +238%
15. Flour +238%
16. Facial Tissues +235%
17. Allergy Medicine +232%
18. Women’s Health +215%
19. Cereals +214%
20. Power Generators +210%
21. Laundry Supplies +200%
22. Household Cleaners +195%
23. Soap and Body Wash +194%
24. Toilet Paper +190%
25. Jerky and Dried Meats +187%
26. Chips and Pretzels +186%
27. Crackers +184%
28. Health Monitors +182%
29. Popcorn +179%
30. Computer Monitors +172%
31. Fitness Equipment +170%
32. Single Vitamins +166%
33. Nut and Seed Butters +163%
34. Cat Food +162%
35. Fruit Snacks +162%
36. Baby Care Products +162%
37. Refrigerators +160%
38. Baking Mixes +160%
39. Toilet Accessories +160%
40. Dog Food +159%
41. Diapers +154%
42. Yoga Equipment +154%
43. Bottled Beverages +153%
44. Baby Meals +153%
45. Cookies +147%
46. Digestion and Nausea +144%
47. Snack Foods +141%
48. Herbal Supplements +136%
49. Cooking Oils +135%
50. Water +130%
51-100 fastest growing e-commerce categories
51. Incontinence and Tommy +129%
52. Multivitamin +126%
53. Cat Litter +125%
54. Training Pads and Trays +125%
55. Juices +125%
56. Smoking Cessation +122%
57. Dried Fruit and Raisins +120%
58. Salt and Pepper Seasoning +118%
59. Craft Kits and Projects +117%
60. Batteries +116%
61. Trash Bags +116%
62. Nuts and Seeds +116%
63. Hair Coloring +115%
64. Sauce and Gravy +115%
65. Deli Foods +114%
66. Syrups +114%
67. Bread and Bakery +114%
68. Minerals +113%
69. Condiments +111%
70. First Aid +108%
71. Nail Care +108%
72. Humidifiers +105%
73. Art Paint +104%
74. Office Chairs +104%
75. Deodorant +103%
76. Jams, Jellies, and Spreads +102%
77. Coffee +101%
78. Spices and Seasonings +100%
79. Skin Care +99%
80. Pain Relievers +99%
81. Cooking Vinegar +98%
82. Air Purifiers +97%
83. Granola and Nutrition Bars +97%
84. Pudding and Gelatin +97%
85. Toy Clay and Dough +95%
86. Single Spices +95%
87. Bird Food and Treats +91%
88. Lab and Science Products +90%
89. Eczema and Psoriasis Care +90%
90. Ping Pong +89%
91. Chocolate +86%
92. Baking Ingredients +84%
93. Energy Supplements +84%
94. Respiratory +82%
95. Office Desks +89%
96. Potty Training Supplies +82%
97. Herbs, Spices, and Seasonings +82%
98. Keyboard and Mice +80%
99. Body Lotion +79%
100. Safes +69%
The fastest declining e-commerce categories in March 2020, were:
-
- luggage & suitcases (-77%)
- briefcases (-77%)
- and cameras (-64%)
(Source: Stackline).
1-50 fastest declining e-commerce categories
1. Luggage and Suitcases -77%
2. Briefcase -77%
3. Cameras -64%
4. Men’s Swimwear -64%
5. Bridal Clothing -63%
6. Men’s Formal Wear -62%
7. Women’s Swimwear -59%
8. Rash Guards -59%
9. Boy’s Athletic Shoes -59%
10. Gym Bags -57%
11. Backpacks -56%
12. Snorkeling Equipment -56%
13. Girl’s Swimwear -55%
14. Baseball Equipment -55%
15. Event and Party Supplies -55%
16. Motorcycle Protective Gear -55%
17. Camera Bags and Cases -54%
18. Women’s Suits and Dresses -53%
19. Women’s Boots -51%
20. Cargo Racks -51%
21. Women’s Sandals -50%
22. Drones -50%
23. Boy’s Active Clothing -50%
24. Lunch Boxes -50%
25. Store Fixtures and Displays -50%
26. Automotive Mats -50%
27. Men’s Outerwear -49%
28. Watches and Accessories -49%
29. Cargo Bed Covers -48%
30. Track and Field Equipment -48%
31. Ceiling Lighting -47%
32. Camera Lenses -47%
33. Girl’s Coats and Jackets -47%
34. Women’s Hats and Caps -47%
35. Women’s Outerwear -47%
36. Video Cameras -46%
37. Wheels and Tires -46%
38. Motorcycle Parts -45%
39. Women’s Wallets -45%
40. Shocks and Struts -44%
41. Transmission and Parts -44%
42. Girl’s Athletic Shoes -44%
43. Women’s Shoes -44%
44. Telescopes -44%
45. Sunglasses and Eyeglasses -43%
46. Men’s Tops -41%
47. Video Projectors -40%
48. Men’s Athletic Shoes -40%
49. Marine Electronics -40%
50. Hand Tools -40%
51-100 fastest declining e-commerce categories
51. Wine Racks -40%
52. Men’s Shoes -40%
53. Clocks -39%
54. Baby Girl’s Shoes -39%
55. Bracelets -39%
56. Men’s Boots -39%
57. Tapestries -39%
58. Camping Equipment -39%
59. Men’s Bottoms -38%
60. Cell Phones -38%
61. Tool Storage and Organizers -38%
62. Necklaces -38%
63. Swimming Equipment -37%
64. Men’s Hats and Caps -37%
65. Girl’s Shoes -37%
66. Industrial Tools -36%
67. Juicers -36%
68. Desktops -35%
69. Classroom Furniture -35%
70. Bar and Wine Tools -35%
71. Glassware and Drinkware -35%
72. Musical Instruments -34%
73. Power Winches -34%
74. Home Bar Furniture -34%
75. Office Storage Supplies -34%
76. Girl’s Active Clothing -34%
77. Women’s Tops -34%
78. Braces, Splints, and Supports -34%
79. Car Anti-theft -34%
80. Rings -34%
81. Blankets and Quilts -33%
82. Women’s Athletic shoes -33%
83. Kitchen Sinks -33%
84. Golf Clubs -33%
85. Equestrian Equipment -33%
86. GPS and Navigation -32%
87. Recording Supplies -32%
88. Home Audio -32%
89. Boy’s Accessories -32%
90. Earrings -32%
91. Dining Sets -31%
92. Calculators -31%
93. Boys Shoes -31%
94. Volleyball Equipment -31%
95. Strollers -31%
96. Coolers -30%
97. Sanders and Grinders -30%
98. Men’s Active-wear -29%
99. Living Room Furniture -29%
100. Climbing and Hiking Bags -28%
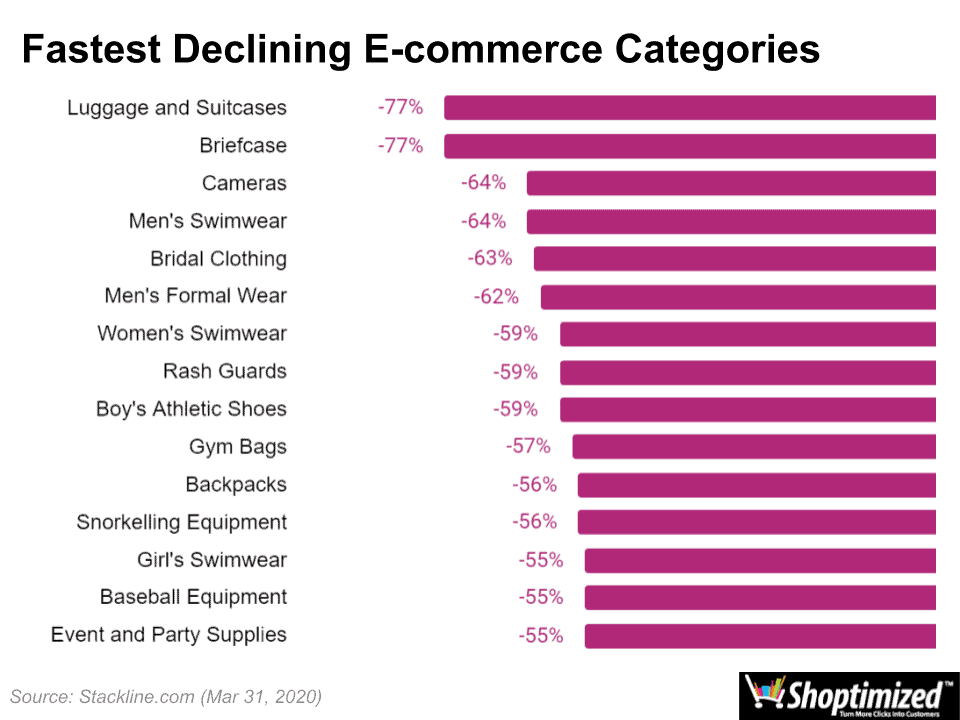
Fastest Declining E-commerce Categories
During self-isolation, as consumers are getting through their respective quarantine and movement restrictions, like leisure/hobby categories are seeing the highest volatility in the search results (Source: SEMrush).
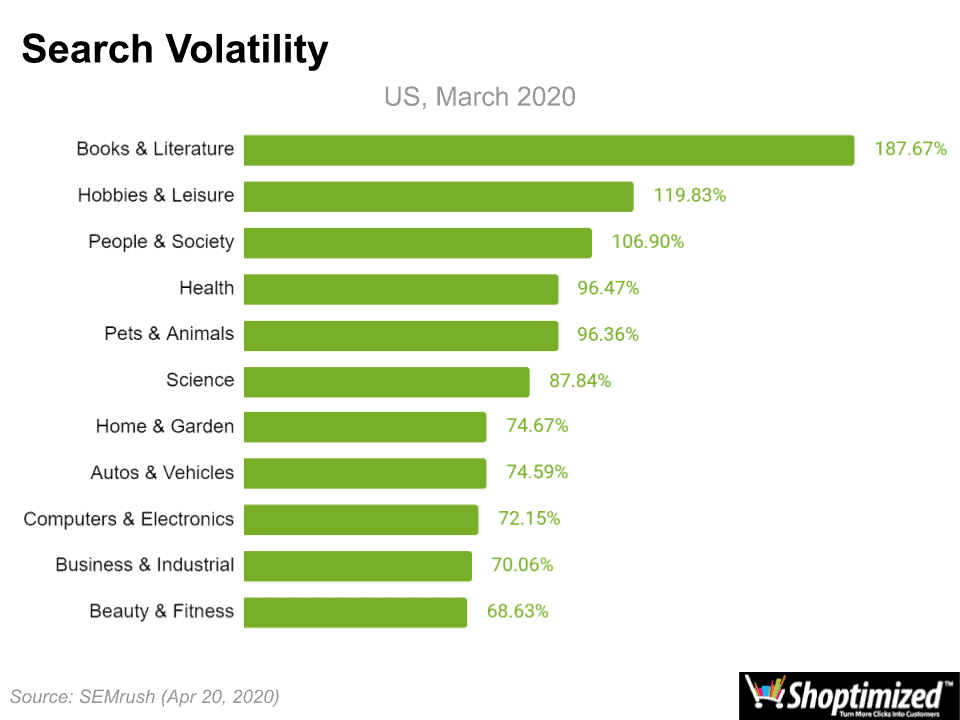
Search Volatility
Books and literature on the other hand saw the continuing rise of audiobooks with Scribd and Audible taking the top spots. Immediately made Scholastic and Chegg became the default choices for students forced to study at home (Source: SEMrush).
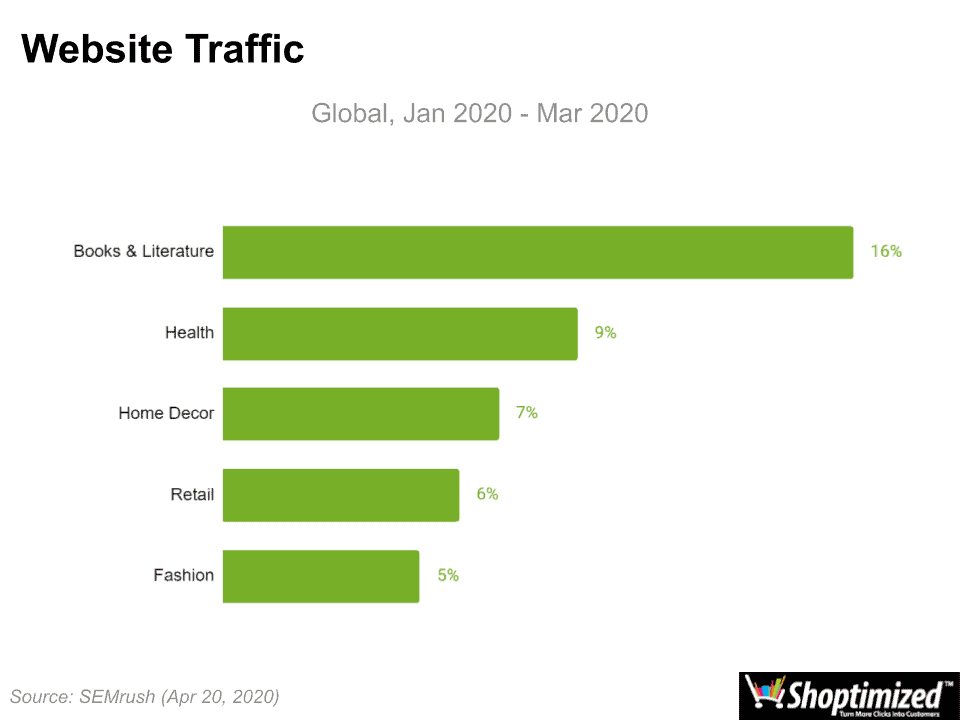
Website Traffic
- Remote working platforms also stand out as one of the market winners by search data and traffic trends (Source: SEMrush).
[learn_more caption=”Market Winners by Search Data and Traffic Trends”]
- Traffic to the web conferencing platform Zoom has increased by 67 million users during the month of March 2020. Also, search volume for Zoom rose by 1562% from February to March 2020 (Source: SEMrush).
- Home exercise also made a drastic spike in online searches in March. The graph below shows the trend of searches for all analyzed keywords related to home fitness extremely went above. (Source: SEMrush).
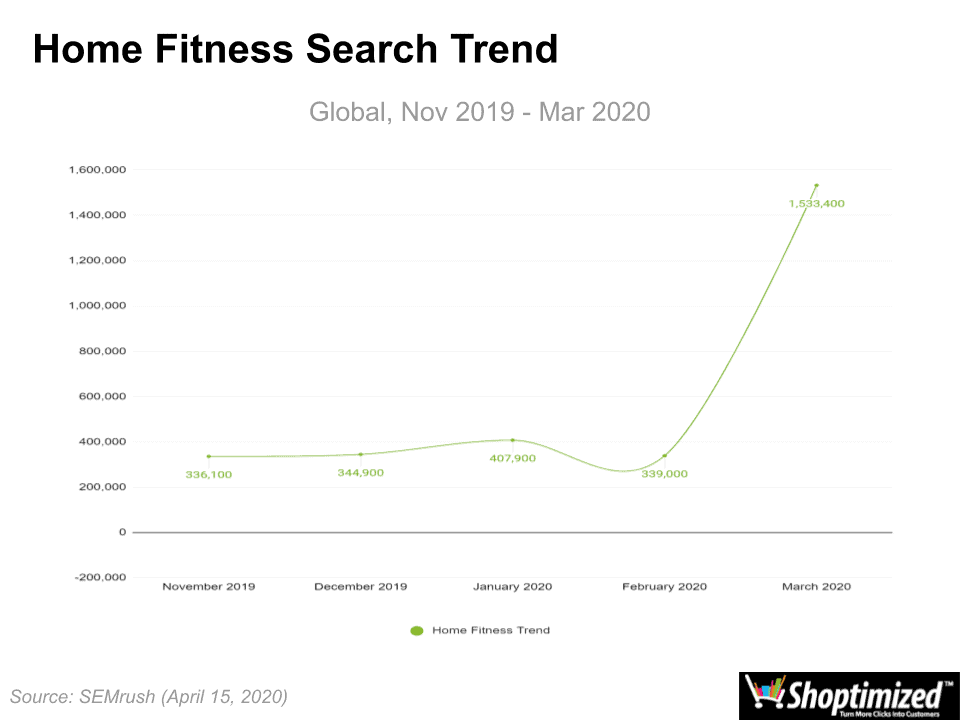
Home Fitness Search Trend
- On average, some of the biggest streaming services gained an unprecedented 87.6% rise in searches for the month of March. An example would be the 232% rise in search volume received by Disney+ from February to March (Source: SEMrush).
- SEMrush data supports concerns that online gambling is indeed on the rise. During the month of March, traffic to online gambling websites increased globally by an estimate of 9% (Source: SEMrush).
- SEMrush Traffic Analytics reveals that the traffic for online dating websites has been on a continuous rise since January. In March, site visits increased by 2% (Source: SEMrush).
- On average, food delivery services increased by 56%, and Amazon Fresh and Instacart are the 2 food delivery companies that showed the greatest rise, with up to 200% increase in their services (Source: SEMrush).
- Highlighting the turmoil in the world’s financial markets, the traffic for Global Stock Exchanges escalated by 18.6% for the month of March (Source: SEMrush).
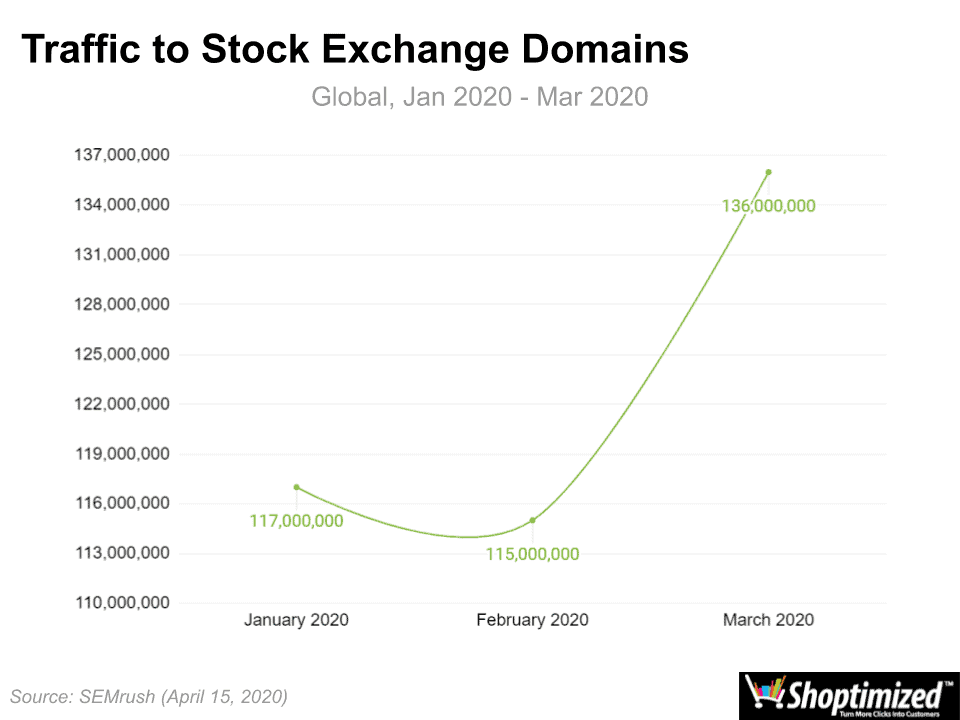
Traffic to Stock Exchange Domains
- In March, traffic to websites offering online courses and training for children saw a 29.31% surge in numbers (Source: SEMrush).
- Traffic to cooking websites offering recipes and videos has increased by 6% as well (Source: SEMrush).
[/learn_more]
- However, as the crisis was beginning to unfold, airline stocks indeed fell an average of 19.1% from February 19 to February 27 (Source: SEMrush).
[learn_more caption=”Market Losers by Search Data and Traffic Trends”]
- Another industry that suffered is during the pandemic is the events industry. With a number of key events like Ultra Music Festival, SXSW, Coachella, and Formula 1 postponed or canceled for 2020, people couldn’t help but express their frustrations online (Source: SEMrush).
- On average, hotel, resort, and cruise line stocks plummeted by about 22.2% from February 19 to February 27 (Source: SEMrush).
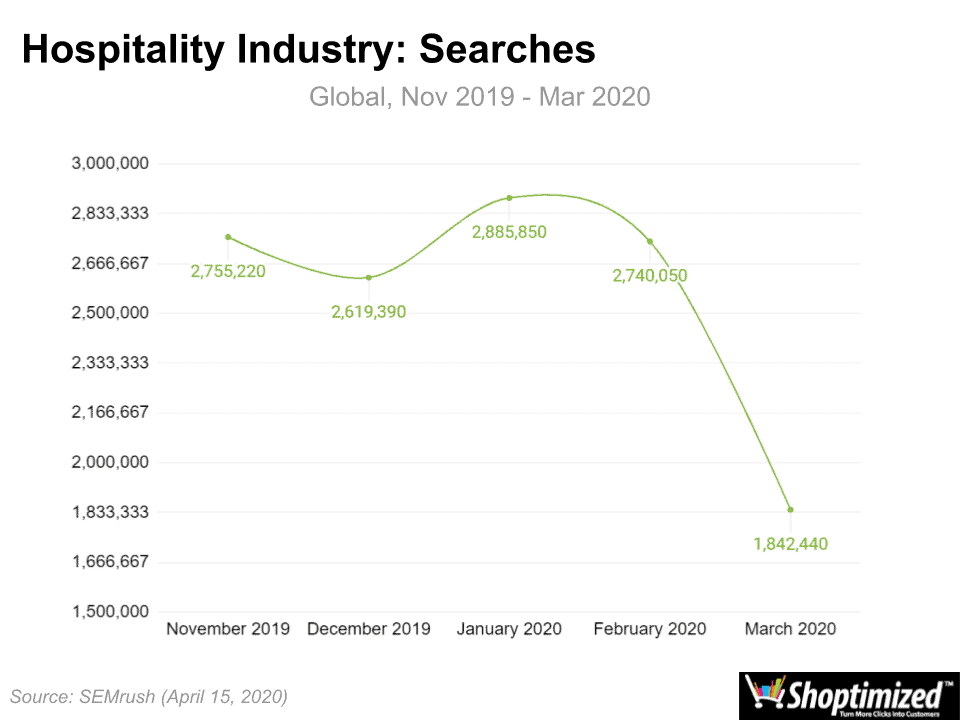
Hospitality Industry Searches
- With the global pandemic, visits to weather websites have also slightly decreased. On average, weather sites were losing, 0.4% of their global traffic in March (Source: SEMrush).
- Various businesses have also been affected during the COVID-19 pandemic, including restaurants. Research shows that OpenTable saw the most loss with up to 11% decrease in their site traffic. Moreover, even Mcdonald’s saw a fall of 2% for their site (Source: SEMrush).
[/learn_more]